3 Steps to Become a Millionaire in Malaysia Futures Market
There are 2 famous and active Futures products in Malaysia
1. Futures Kuala Lumpur Index ( FKLI ) and,
2. Crude Palm Oil Futures ( FCPO )
Below are the steps to start Futures trading;
1. Open Account - with any legal Futures Broking House in Malaysia
- totally “free” and no fees required.
2. Deposit of Initial Margin
- “not” compulsory to deposit any $ after account opened.
- Deposit “only” when you are getting ready to trade.
- RM3,500 per contract for FKLI.
- RM 3,000 per contract for FCPO.
* For example, if you want to trade only 1 contract of FCPO, then the minimum margin you have to deposit is RM 3,000. However, you “MUST” follow the “RULES” as below where to trade 1 FCPO is advised to deposit at least RM 6,000-8000 in your account as backup.
3. Place Order - Call your broker to give buy / sell.order.
- Standard commission rate is ( RM 50/round turn for
FKLI).
- ( RM60/round turn for FCPO ).- When to buy/sell?? Please follow system given below.
For details on contract specification or historical Futures prices you can browse at website below,
-BursaMalaysia Derivatives Sdn Bhd
-Malaysia Palm Oil Board (MPOB)
Please refer WWW.ECFUTURES.COM for latest update,thank. For account opening and real times prices update, you can browse at website below,
-OSK
-CIMB
-TA Futures
-Hwang DBS Futures
-NextView
RULES
1. "MUST" follow every suggestion given daily (Always holding position provided you prepare to quit one day).
2. "NEVER" invest >�50% out of our capital (Ideal 20-30%). Balance of modal must ready as backup.
3. "INCREASE" position only after 20-30%�increase in capital.�
�
FUTURES KUALA LUMPUR INDEX
Tomorrow Suggestion: (14-03-2007).�� DISCLAIMER
�
Step 1: Holding Long�( Buy ) March contract�@�1160.0.�
�
Step 2:��Sell Stop�( Short ) March�@�1149.0�(subject to daily changes).�
�
Step 3:�Turn�Short (Sell) March once stop loss triggered. Everytime put 10 points as cut loss for new position built up.
DISCLAIMER
�
�
�


 TheChargingBull's Bursa Malaysia Stock Trading Diary
| INITIAL CAPITAL = RM 50,000 | ||||||
| INITIAL MARGIN = RM 3,500 (FKLI) , RM 3,000 (FCPO) | ||||||
| ASSUME STANDARD COMISSION- | ||||||
| (FKLI RM 50 /Round Turn) | ||||||
| (FCPO RM 60 /Round Turn) | ||||||
| FKLI | ||||||
QUANTITY | POSITION | ENRTY DATE | ENRTY POINT | EXIT POINT | P/L(RM) | |
1 | 8 | Buy (Feb) | 25/1/2006 | 902.5 | 924.5 | +8,400 |
2 | 8 | Sell (Feb) | 17/2/2006 | 923.0 | 923.0 | -400 |
3 | 8 | Buy (Mar) | 24/2/2006 | 923.0 | 918.5 | -2,200 |
4 | 8 | Sell (Mar) | 2/3/2006 | 918.5 | 917.0 | +200 |
5 | 8 | Buy (Mar) | 9/3/2006 | 917.0 | 915.0 | -1,200 |
6 | 8 | Sell (Mar) | 16/3/2006 | 915.0 | 921.5 | -3,000 |
7 | 8 | Buy (April) | 24/3/2006 | 917.0 | 927.0 | +3,600 |
8 | 8 | Sell (April) | 31/3/2006 | 927.0 | 927.5 | -600 |
9 | 8 | Buy (April) | 4/4/2006 | 927.5 | 931.5 | +1,200 |
10 | 8 | Sell (April) | 12/4/2006 | 931.5 | 933.5 | -1,200 |
11 | 8 | Buy (May) | 17/4/2006 | 931.0 | 942.0 | +4,000 |
12 | 8 | Sell (May) | 2/5/2006 | 942.0 | 948.5 | -3,000 |
13 | 8 | Buy (May) | 5/5/2006 | 948.5 | 951.5 | +800 |
14 | 18 | Sell (May) | 15/5/2006 | 951.5 | 924.0 | +23,850 |
15 | 36 | Sell (June) | 1/6/2006 | 909.0 | 883.5 | +44,100 |
16 | 55 | Buy (June) | 20/6/2006 | 883.5 | 914.5 | +82,500 |
17 | 80 | Buy (July) | 3/7/2006 | 900.0 | 904.5 | +14,000 |
18 | 80 | Sell (July) | 5/7/2006 | 904.5 | 902.0 | +6,000 |
19 | 80 | Buy (July) | 10/7/2006 | 902.0 | 902.5 | -2,000 |
20 | 80 | Sell (July) | 14/7/2006 | 902.5 | 906.5 | -20,000 |
21 | 80 | Buy (July) | 20/7/2006 | 906.5 | 936.5 | +116,000 |
22 | 120 | Sell (Aug) | 1/8/2006 | 919.0 | 927.5 | -57,000 |
23 | 100 | Buy (Aug) | 1/8/2006 | 927.5 | 927.0 | -7500 |
24 | 100 | Sell (Aug) | 10/8/2006 | 927.0 | 937.0 | -55,000 |
25 | 80 | Buy (Aug) | 11/8/2006 | 937.0 | 958.0 | +80,000 |
26 | 80 | Buy (Sept) | 1/9/2006 | 962.0 | 952.0 | -44,000 |
27 | 60 | Sell (Sept) | 5/9/2006 | 952.0 | 951.0 | +0 |
28 | 60 | Buy (Sept) | 13/9/2006 | 951.0 | 952.0 | +0 |
29 | 60 | Sell (Sept) | 20/9/2006 | 952.0 | 962.0 | -33,000 |
30 | 60 | Buy (Sept) | 21/9/2006 | 962.0 | 965.5 | +7500 |
31 | 60 | Buy (Oct) | 2/10/2006 | 958.5 | 971.0 | +34,500 |
32 | 60 | Sell (Oct) | 18/10/2006 | 971.0 | 981.0 | -33,000 |
33 | 60 | Buy (Oct) | 26/10/2006 | 981.0 | 987.0 | +15,000 |
34 | 60 | Buy (Nov) | 1/11/2006 | 987.5 | 1080.5 | +276,000 |
35 | 120 | Buy (Dec) | 1/12/2006 | 1073.5 | 1061.5 | -78,000 |
36 | 100 | Sell (Dec) | 6/12/2006 | 1061.5 | 1071.5 | -55,000 |
37 | 100 | Buy (Dec) | 6/12/2006 | 1071.5 | 1084.5 | +60,000 |
38 | 100 | Sell (Dec) | 13/12/2006 | 1084.5 | 1091.5 | -40,000 |
39 | 100 | Buy (Dec) | 18/12/2006 | 1091.5 | 1081.5 | -55,000 |
40 | 80 | Sell (Dec) | 18/12/2006 | 1081.5 | 1073.5 | +28,000 |
41 | 80 | Buy (Dec) | 22/12/2006 | 1073.5 | 1092.5 | +72,000 |
42 | 100 | Buy (Jan) | 3/1/2007 | 1092.0 | 1110.0 | +85,000 |
43 | 100 | Sell (Jan) | 10/1/2007 | 1110.0 | 1112.5 | -17,500 |
44 | 100 | Buy (Jan) | 12/1/2007 | 1112.5 | 1186.0 | +362,500 |
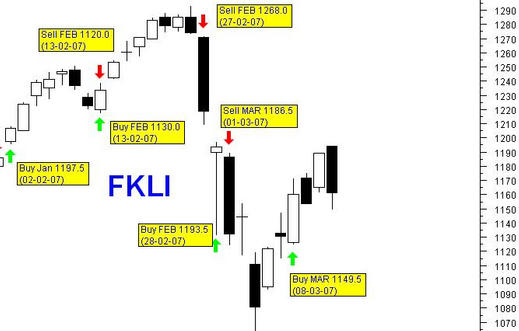
45 | 120 | Buy (Feb) | 2/2/2007 | 1197.5 | 1220.0 | +129,000 |
46 | 130 | Sell (Feb) | 13/2/2007 | 1220.0 | 1230.0 | -71,500 |
47 | 130 | Buy (Feb) | 13/2/2007 | 1230.0 | 1268.0 | +240,500 |
48 | 150 | Sell (Feb) | 27/2/2007 | 1268.0 | 1193.5 | +551,250 |
49 | 150 | Sell (Mar) | 1/3/2007 | 1186.5 | 1149.5 | +270,000 |
50 | 150 | Buy (Mar) | 8/3/2007 | 1149.5 | 1150.0 | -3750 |
51 | 150 | Sell (Mar) | 13/3/2007 | 1150.0 | 1160.0 | -82500 |
52 | 150 | Buy (Mar) | 13/3/2007 | 1160.0 | 1161.0* |
|
|
|
|
|
|
|
|
|
|
|
|
|
|
|
FCPO |
|
|
|
|
| |
| QUANTITY | POSITION | ENRTY DATE | ENRTY POINT | EXIT POINT | P/L(RM) |
1 | 10 | Buy (Apr) | 16-1-06 | 1425 | 1467 | +9,900 |
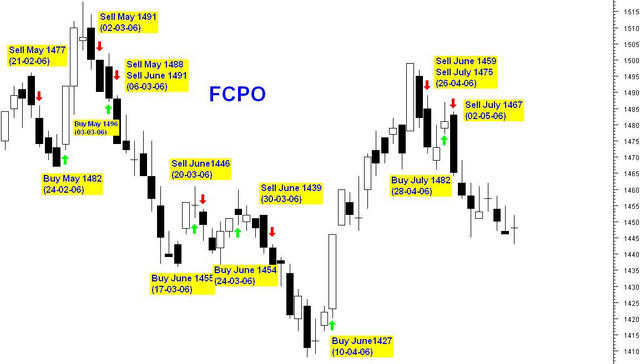
2 | 10 | Sell (May) | 21-2-06 | 1477 | 1482 | -1,850 |
3 | 10 | Buy (May) | 24-2-06 | 1482 | 1491 | +1,650 |
4 | 10 | Sell (May) | 2/3/2006 | 1491 | 1496 | -1,850 |
5 | 10 | Buy (May) | 3/3/2006 | 1496 | 1488 | -2,600 |
6 | 10 | Sell (June) | 6/3/2006 | 1491 | 1455 | +8,400 |
7 | 10 | Buy (June) | 17-3-06 | 1455 | 1446 | -2,850 |
8 | 10 | Sell (June) | 20-3-06 | 1446 | 1454 | -2,600 |
9 | 10 | Buy (June) | 24-3-06 | 1454 | 1439 | -4,350 |
10 | 10 | Sell (June) | 30-3-06 | 1439 | 1427 | +2,400 |
11 | 10 | Buy (June) | 10/4/2006 | 1427 | 1459 | +7,400 |
12 | 10 | Sell (July) | 26-4-06 | 1475 | 1482 | -2,350 |
13 | 10 | Buy (July) | 28-4-06 | 1482 | 1467 | -4,350 |
14 | 10 | Sell (July) | 2/5/2006 | 1467 | 1448 | +4,150 |
|
|
|
|
|
|
|
| *THIS FIGURE IS FOR UNREALISED PROFIT CALCULATION PURPOSE. NOT AS GUIDE POINT TO EXIT. | ||||||
| TO EXIT PLEASE REFER SUGGESTION STEPS "3" AS ABOVE ONLY. | ||||||
| UNREALISED PROFIT / LOSS = | RM+ 0 | ( *Base on today settlement ) | ||||
| REALISED PROFIT = | RM+1,989,650 | |||||
| ACCUMULATED CAPITAL = | RM+2,039,650 | |||||
| TOTAL RETURN % = | 3979% | |||||
CRUDE PALM OIL FUTURES
Terminated due to difficulty on getting CPO data. Thanks.Step 1: .
Step 2: .Step 3: .
Any enquiries please contact millionairefutures@gmail.com
Url : http://millionaire-futures.50megs.com

